How to view the Salon and Team Dashboard
Services, Brands and Promotions
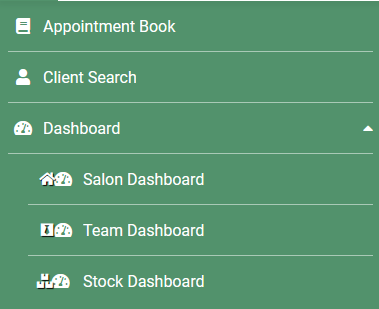
Main Menu > Dashboards > Salon Dashboard
Main Menu > Dashboards > Team Dashboard
The Dashboard provides comprehensive insights, including forecasts and detailed reports.
You can customise the Dashboard by adding or removing columns of information. To do this, simply click the three dots in the top right corner and toggle the options you'd like to display.

Column Calculations
- Salon: The salon name will be displayed on the left column, if you are a multi-site group, all salons will be shown providing you have access to each individual salon
- Stars: This displays any set targets the salon has achieved, the salon targets can be set up in Salon Settings (Main Menu > Settings > Salons > KPI's)
- Flags: This displays if the salon is yet to reach any minimum targets set within the Salon KPI's section
- Takings: This figure shows the takings which have been physically processed through the system
- Services: This column has two features, it displays the "Income projection" which adds all the appointments in the salon up to the selected date - this is displayed in real time and gives a income projection based on appointments. The second figure "Services so far" displays the services which have been checked out and processed. It will then display a "Total" figure which adds the projection and services so far to give predicted salon figure.
- Retail: This shows how much retail has been sold within a specified time frame
- Retail % -Retail £ / (retail £ + service £) times 100
- Care Factor: This is calculated on clients who have just had a service in the salon. It does not include any walk in retail sales. Care Factor is a %, if you have 10 clients in, 3 of those purchased a retail item this would be 30%
- Client Count: Shows how many clients have checked out
- Expected Client Count: Displays the projected client count for the selected time frame, this looks at future appointments.
- Request Rate: This displays the overall percentage of clients asking to see a specific team member within the salon
- Client Retention: This looks at client retention over a 12 week period
- Utilisation: This displays the percentage the team member is booked with appointments based on the column space booked
When the dashboard is run for the full year, the utilisation is calculated using the total utilised hours divided by the total available hours for the entire year, which provides a weighted percentage
Utilisation is calculated based solely on the hours a team member has available for clients. For example, if Cara is scheduled to work 4 hours today but has a 1-hour lunch break, only the remaining 3 hours are considered available for utilisation.
Highlighted in red are the available hours for the team member.

If a team member has a full-day holiday recorded in the schedule, they have no client hours available for that day, resulting in a utilisation rate of 0.
Team Member Jade has a full days holiday, this means there are no client hours for the day. Her utilisation for the day will show as 0.

- Average Frequency: This calculates the last appointment date within the specified date range, and works out what the average weeks between appointments
- Average Retail: This calculates the average retail spend for the salon.
- Average Service: This calculates the average service spend within the salon
- Client Feedback: This displays the average score based on client reviews left within the specified date range, it also allows you to click on the data to see who has left reviews and to select if you want to publish them on your online bookings portal
- Courses Done: This displays the value of course sold in salon within a specified time frame
- Gift Cards: This provides information on the value of gift cards sold with the selected time frame.
- New Client Retention: This looks at new client retention over a 12 week period, and calculates the percentage of clients who have rebooked and those who have not.
- Non-Transient Client: This provides information on how may "Non Transient" clients have visited the salon within the specified time frame. Please Note: To mark a client as "Non Transient, this needs to be done within the details section of the individual client card
The Overview screen
The next section below the various information columns is the over-view section, this displays all of the key information within the selected time frame.

The information displayed is not customisable, however covers:
- Total Clients: The total number of clients within the selected time frame
- New Clients: The total number of new clients within the selected time frame
- Requests: The total number and percentage of clients who requested a team member by name
- New Requests: The total number of new clients and percentage who requested a team member by name
- Non-Requests:
- Average Bill: This displays the salon average bill within the selected time frame
- Care Factor: This is calculated on clients who have just had a service in the salon. It does not include any walk in retail sales. Care Factor is a %, if you have 10 clients in, 3 of those purchased a retail item this would be 30%
- Internet Bookings: This displays the number of bookings made online
- No Shows: This displays the number of appointments made by clients who then failed to turn up
- Rebooking: Displays the number of rebooking's made within the specified time frame. A rebooking is counted when a client who has visited the salon within that date range schedules their next appointment 24 hours after their last visit. Note that any appointments already scheduled for the future will not be considered as part of the rebooking percentage.
Services / Brands / Promotions Used
- Services: In this section, you are able to view a breakdown of service based on the category the service is matched too, along with how many individual services were completed and the value.
- Brands: You can view the brands and retail products which were sold within the specified time frame. By clicking the orange number under "units" will allow you further information such as the retail product sold, the date in which is was sold along with the client and team member information.
- Promotions Used: This displays any active promotions which have been applied within the specified time frame. This will show how many of each promotion has been used (units) and by clicking on the orange number under units will display further information such as the date applied, the promotion name, client name and team member.

Graph Chart
There are multiple graph charts available for you to view, to edit the chart you wish to view just select from the drop down box above the chart. These can show information based on the specified date frame or duration you have chosen. These charts show how you are performing against any Salon KPI's (Key Performance Indicator) you have set. This will also display your trend (Dashed Lines)

Bar Chart
In this chart, is displays in bar chart form the KPI's vs your actual figures, this is based on the time frame or duration you have selected to view.

Mini Dashboard
Your team can view their own Mini Dashboard by left clicking on their name and clicking Show My Dashboard.

If you need any help with your Salon Dashboard please call us on 01892 280 123 or email help@saloniq.com