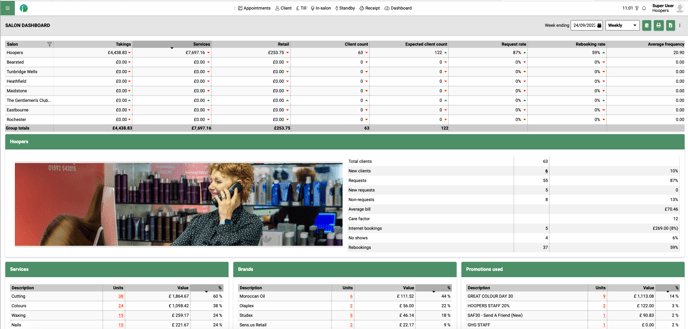
Your salon dashboard is an area on SalonIQ that you would use daily, weekly and monthly. You can find over 25 statistics on your business just from one view meaning you do not have to waste time finding the important information that you need using numerous reports.
To view your salon dashboard please go to Menu > Dashboard > Salon Dashboard
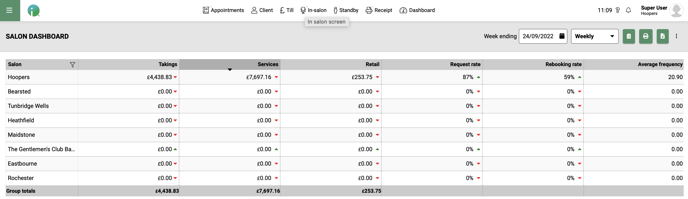
Adjust the date range by clicking on the 'weekly' drop-down menu in the top right-hand corner or by selecting a date from the calendar.
When first loading the dashboard you will see your key columns, these are Takings, Services and Retail. You have the option to customise this view by clicking on the 3 dots (top right-hand corner) and switching the toggles next to each KPI from grey to green. The columns will appear or disappear as you switch each one on/off.
What do the KPIs mean?
| Actual Wages | Total value of wages in £/$ |
| Average Frequency | Average number of weeks in between your clients' appointments |
| Average Retail | Average Retail value |
| Average Services | Average service value |
| Care Factor | Percentage of clients purchasing products against total clients. If 10 clients visit your salon and 5 purchase a product, you would have a 50% Care Factor |
| Client Feedback | total number of feedback surveys received |
| Client Count | Total clients who have been processed at checkout |
| Client Retention | Percentage of clients rationed in a given period |
| Courses Done | Total value of courses done |
| Flags | Shows the KPI’s that you have to work on to better the previous day/week/month figures |
| Gift Cards | Value of gift cards sold |
| New Client Retention | Retention % on new clients only (clients who have had their first visit) |
| Non-Transient Client | A non-transient client is a regular client to your salon |
| Rebooking % | Percentage of clients who have re-booked their appointment (This also includes clients who have re-booked within 24 hrs of their last appointment online) |
| Retail % | Percentage of retail sold against services |
| Retail Units | Number of products sold |
| Request % | Percentage of clients who have requested a particular stylist to look after them |
| Salon Number | This is a unique reference for your salon - this is entered in Settings > Details > SalonIQ |
| Stars | Total number of stars achieved based on the targets you have set for your KPI's |
| Sundries | The total value of sundries processed at checkout |
| Sundries Count | The number of sundries processed at checkout |
| Tech Sold | Total value of tech sold, based on the service setup |
| Tech Done | Total value of tech done, based on the service setup |
| Transient Client Count | A transient client has been marked as transient client in their record card, this removes the client from your re-booking % |
| Utilisation % | Percentage of utilised appointment space. If you have a utilisation percentage of 50%, half of your appointment book has bookings. |
| Wages % | Percentage of your wages against total takings |
| Colour % | Percentage of clients who have had a colour service |
| Treatments % | This is one of your custom KPI's - Percentage of treatments against all other services processed |
| Hair % | This is one of your custom KPI's - Percentage of hair services against all other services processed at checkout |
| Beauty % | This is one of your custom KPI's - Percentage of beauty services processed at checkout against all other services |
Viewing the detail on your salon dashboard
If you are an independent salon you will see just your salon here, if you are part of a multi-site you will see all salons on the salon dashboard providing your security access allows.
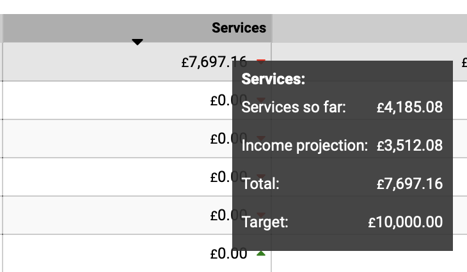
You have the ability to hover over each statistic and view a breakdown.
The services and retail columns when hovered over show you your services processed so far, your income projection (future appointments) your Total, and your target.
The red and green arrows pointing up or down give you a visual indication of you being up or down from the previous day/week/month.
Your Salon Summary
This section of the dashboard shows you a great summary of your salon's performance in the date range selected.
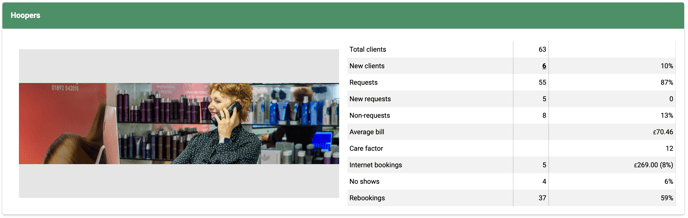 Total Clients - Total number of clients who have been checked out
New Clients - Total number of new clients (clients who have had their first appointment with you)
Requests - Number of clients marked as a request to that team member
New Requests - Number of new clients who have requested a particular stylist
Non-requests - Number of non-request clients
Average Bill - Your average bill in £, this is calculated by looking at your total services divided by the total number of clients processed at checkout.
Care Factor - Percentage of clients purchasing retail. e.g if 10 clients have been in today and 5 of those clients have purchased a product you would have a 50% care factor.
Internet Bookings - Percentage of internet bookings against in-salon bookings
No Shows - Number of appointments marked as a no show
Rebooking - Percentage of clients who have re-booked (this also includes clients who have rebooked within 24 hours of their last appointment)
Any figure you see that is bold and underlines 6 is clickable allowing you to see more information.
Services and Product Breakdown
Services - This section shows you a breakdown of each service category that you have set up within SalonIQ. You will see the description of the service category, the total number of services processed within that category, the value and the percentage, with your total in bold at the bottom.
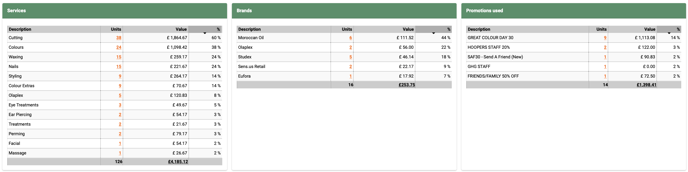
The middle section shows you a summary of the brands you have sold within retail and then the final column gives you a breakdown of the promotions used within the date range you have selected.
Within the Units column, you will see that the orange underlined figures are clickable giving you a further breakdown of the services processed within the date range you have selected.
Visual Graphs
The visual graphs on the salon dashboard give you a great insight into the increase or decline of key areas within your business.
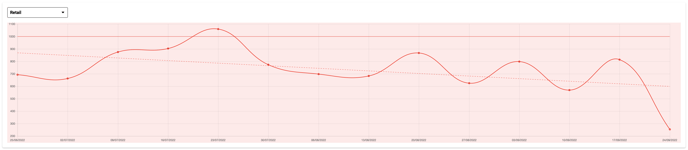
Select the drop-down menu on the left-hand side to change the KPI, there are currently 13 to choose from.
Hover over the graph to view the detail of each data point.
Bold straight line - is your target
Dotted line - is your trend
Wave - shows you a visual increase or decrease over time
These graphs are fantastic to use as visual aids and allow you to see an increase or decrease in performance.
Bar Graphs on the Salon Dashboard
This section is another great area to view to see a visual of your actual service and retail takings against your target and your projection.
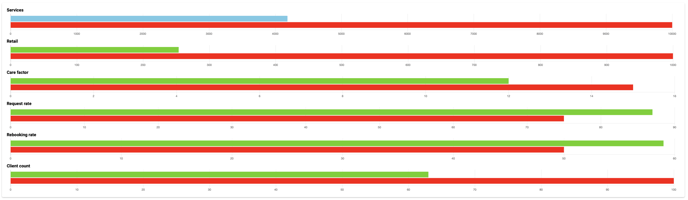
Make sure you hover over each bar as it gives you the actual value in £ or actual % of each KPI based o your current performance in the date range selected.
There is a fair amount to take in here, however, once you become familiar you will love it.
For any questions regarding your Salon Dashboard, please email help@saloniq.com or call 01892 280123 opt. 1