This guide will take through the steps required to view your 365 Tracker and Trend Sheet directly on SalonIQ.
This is not a replacement of your paper trackers and they can of course still be used alongside the 365 Trackers on SalonIQ, the choice is yours.
We will need to activate the 365 option in the main menu on SalonIQ. If you cannot see this please email us with your account code and your request to have 365 access.
Please note this option is only available to paying 365 members. If you would like to know more information about 365 please contact Victoria directly on Victoriap@365hair.com
To view the Performance Tracker, please click here
To view the Build Trend Sheet, please click here
To find out how to email or schedule the reports, please click here
Team Period Inputs
You first need to enter your team period inputs into SalonIQ, this will allow the system to pull the correct figures into the right date range.
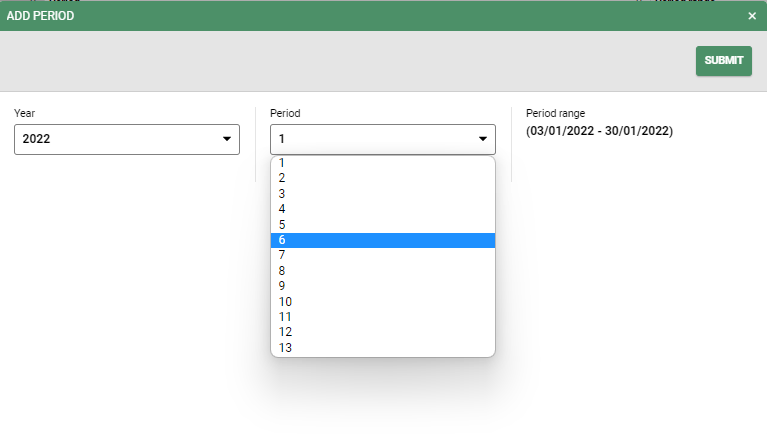
Go to Menu > 365 > Team Period Inputs > If you have not been in this area before you will see that it is blank > Click on Add period > Select the Year from the drop down menu, followed by the Period.
You will now see the date range has automatically been selected for you.
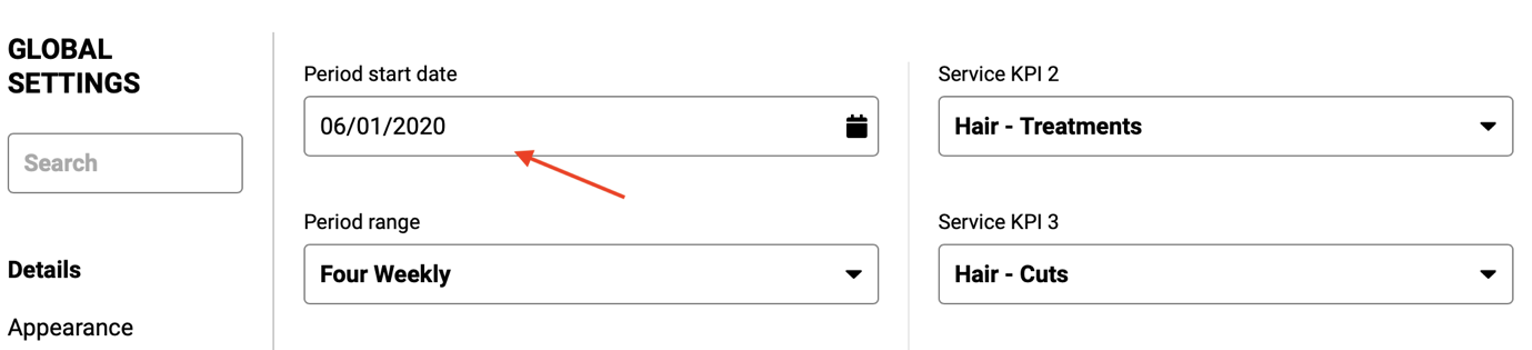
If the date range does not match the period you will need to change the Period start date in Global Settings.
To do this go to Menu > Settings > Global settings > On the Period start date field, select the first day of the period, this can be any period in the past > Click Save before you leave this screen.
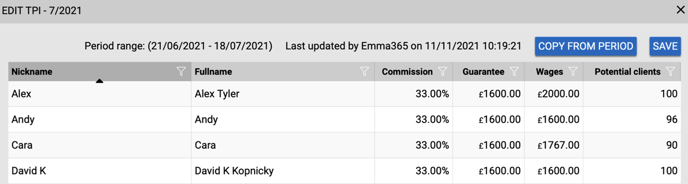
Once you have entered your team period inputs you are then ready to enter the;
- Commission
- Guarantee
- Wages
- Potential Clients
To do this simply click on the team members commission field and enter the correct commission %
Tip: Saving time entering the data - You have the option to copy data from another period you have already done. 95% of the time the Commission %, guarantee and potential clients will always be the same, it is just the wages figure that will vary each month.
Copy from Period
To copy from period, select the period you wish to work on, then select ‘Copy from period’
Select the period you wish to copy from.
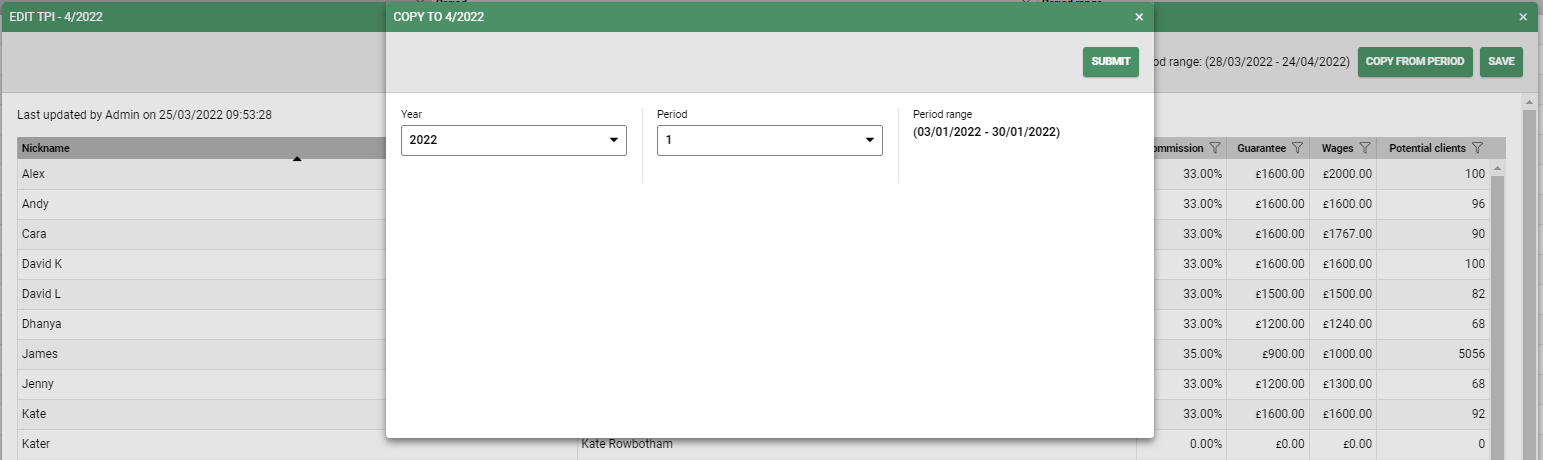
This will complete all 4 fields for you Commission, Guarantee, wages and potential clients – all you need to do is enter the correct figures in for the wages column for each team member. When you are done click save.
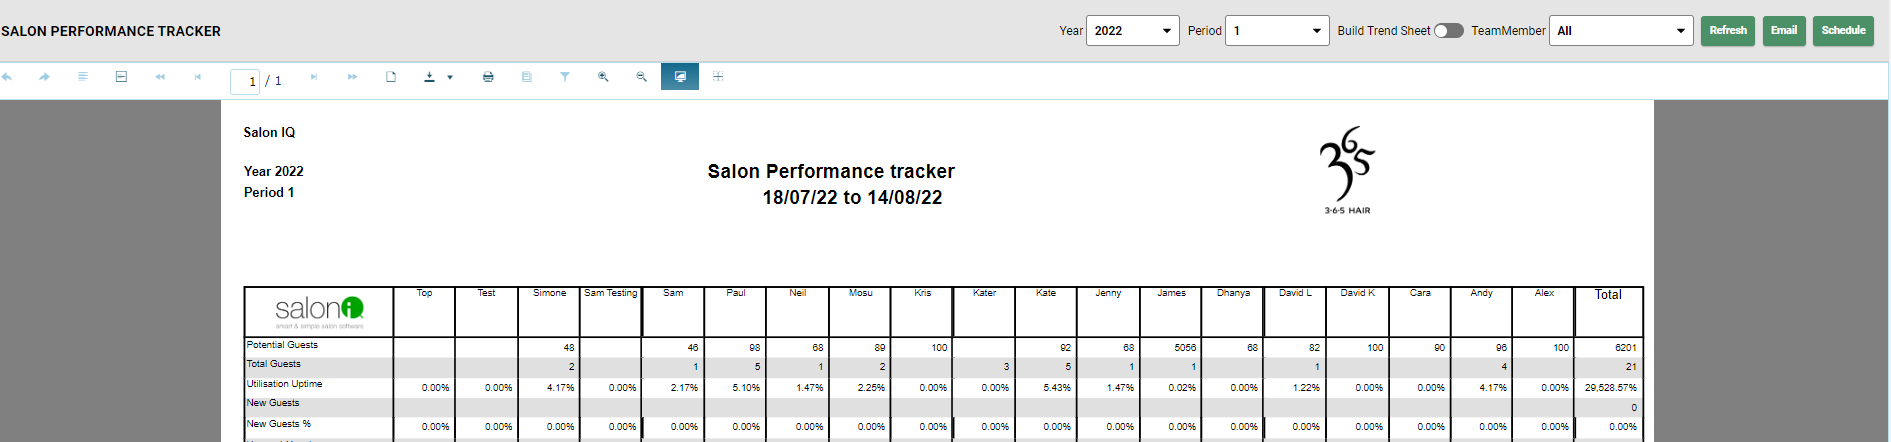
Performance Tracker
To access the performance tracker on SalonIQ go to Menu > 365 > Performance Tracker > Select the Year and the Period you wish to view > Select all team members or a particular team member from the drop-down menu.
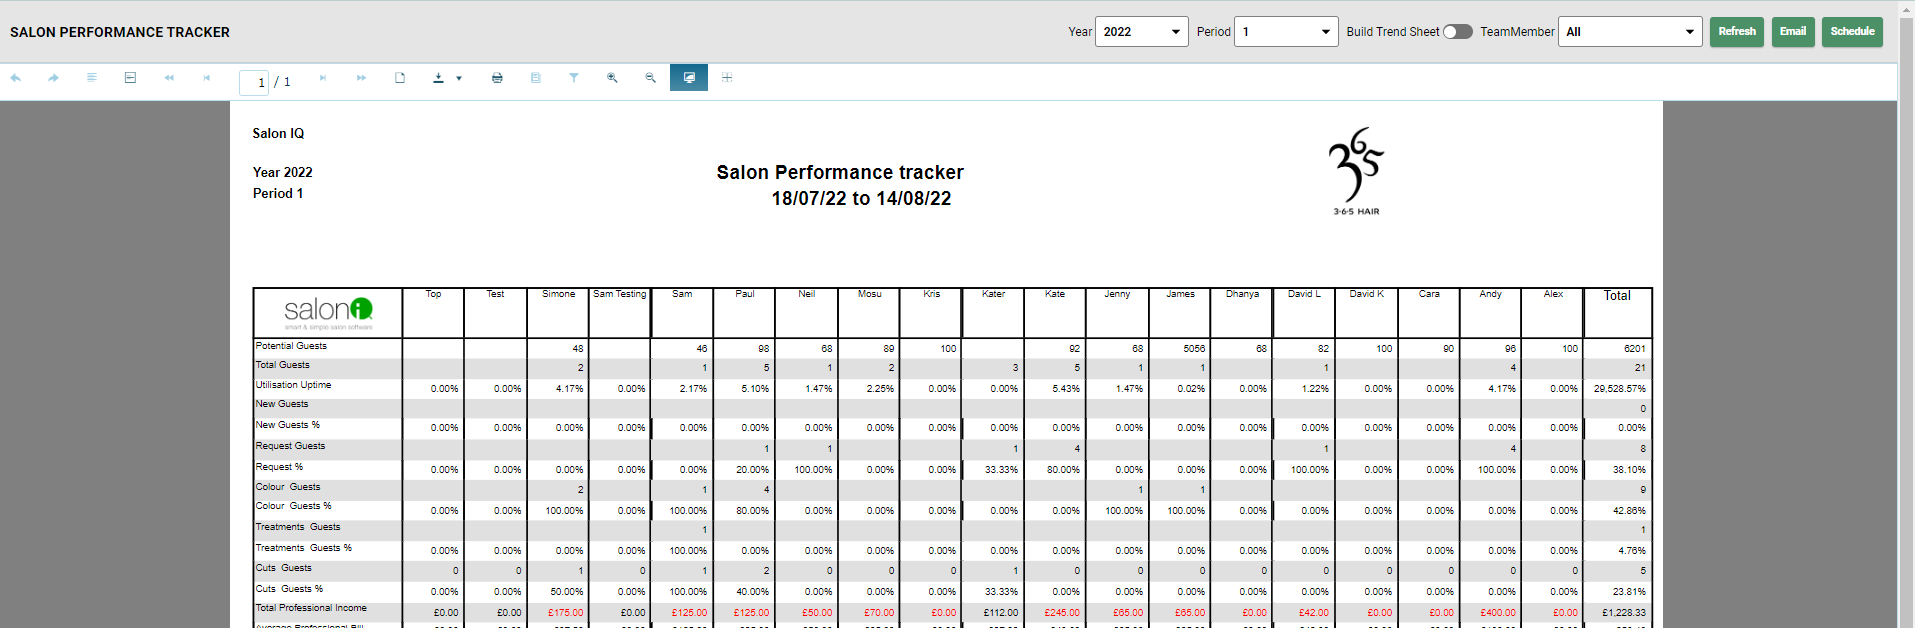
Each time you select a new year, period, team member and refresh the grid, you will see new data that is relevant to your selection.
The Salon performance tracker is the same as the ones you use on Excel, or many years ago when they were on paper.
What can you see on this report?
Potential clients – Number of clients the team member can potentially do if fully utilised
Total Guests – Total number of guests in the selected period
Utilisation Uptime – Percentage of utilisation in the given period
New Guests – Number of new guests
Request Guests - Number of request guests
Request % - Request % against non-request guests
Colour Guests – Number of guests having a colour service in that date range for that team member
Colour Guests % - Percentage of guests having a colour service against all other services booked with this team member
Treatments Guests – Number of guests having a treatment service
Treatments Guest % - Percentage of guests having a treatment against all other services
Cuts Guests – Number of guests having a cut service
Cuts Guests % - Percentage of guests having a cut against all other services
Total Professional Income – Total income for that team member in that period
Average Professional Bill – Average bill for that team member in the given period
Total Take Home Takings – Total takings for that team member
Average Take Home Per Guest – Average take home in that period per guest
Guest Purchasing Take Home – Number of guests purchasing take home
Care Factor – % of clients purchasing retail against all those who have not
Number of Re-bookings – Number of guests who have rebooked
Rebooking % - Percentage of rebooking’s against those who have not rebooked
Avg Guests Per Week – Average number of guests per week
Guarantee – This is the figure you have entered into the team period input
Commission – The percentage entered in the team period input
Pivot Point – The amount that needs to be generated for the team member to earn commission
Avg Prof income per week – Average income per week for the date the period selected
Wages inc NIC – Wage total
Wages as % of income – Percentage of wages against total income
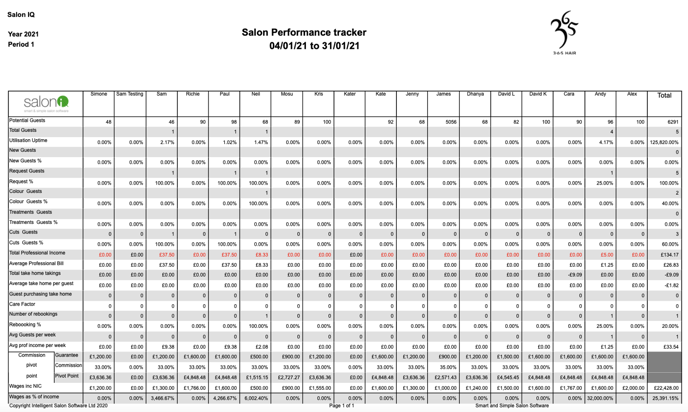
You can view this for the salon as a whole or for each individual team member.
Build Trend Sheet
To view the Trend sheet on SalonIQ, go to Menu > 365 > Performance Tracker > select the Year, Period and switch the Build Trend Sheet toggle from grey to green (on) > Click Refresh.
This will pull through all the relevant data to build the trend sheet for you. If you have selected all team members you will view the salon as a whole, if you select just one team member, you will see the one team members figures for the period in question.
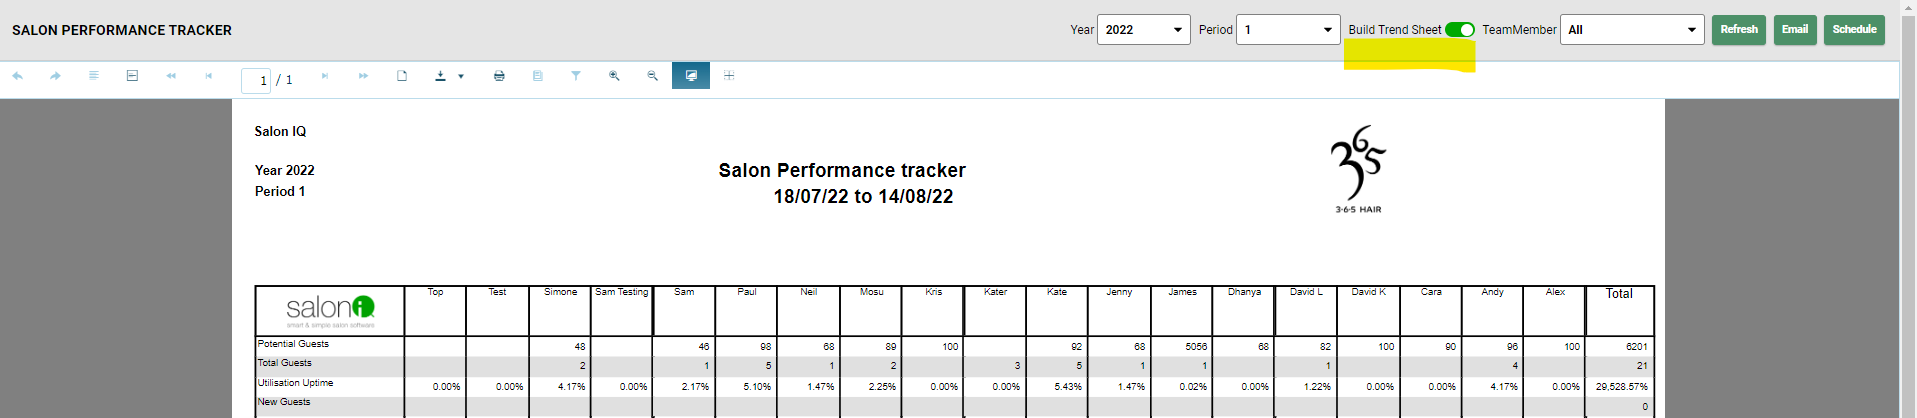
Please note you must have your team period inputs complete to view each period for the year on the performance tracker.
Viewing the Salon Performance Trend
The Salon performance trend sheet is exactly the same as the trend sheet you are familiar with on excel. Instead of inputting each figure from your system and into your spreadsheet, SalonIQ will pull through all of the information automatically as it is already there.
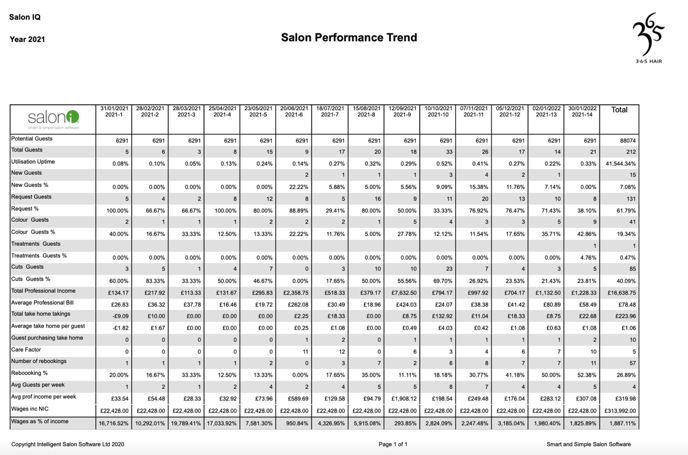
What does this report show?
Potential clients – Number of clients the team member can potentially do if fully utilised
Total Guests – Total number of guests in the selected period
Utilisation Uptime – Percentage of utilisation in the given period
New Guests – Number of new guests
Request Guests - Number of request guests
Request % - Request % against non-request guests
Colour Guests – Number of guests having a colour service in that date range for that team member
Colour Guests % - Percentage of guests having a colour service against all other services booked with this team member
Treatments Guests – Number of guests having a treatment service
Treatments Guest % - Percentage of guests having a treatment against all other services
Cuts Guests – Number of guests having a cut service
Cuts Guests % - Percentage of guests having a cut against all other services
Total Professional Income – Total income for that team member in that period
Average Professional Bill – Average bill for that team member in the given period
Total Take Home Takings – Total takings for that team member
Average Take Home Per Guest – Average take home in that period per guest
Guest Purchasing Take Home – Number of guests purchasing take home
Care Factor – % of clients purchasing retail against all those who have not
Number of Re-bookings – Number of guests who have rebooked
Rebooking % - Percentage of rebooking’s against those who have not rebooked
Avg Guests Per Week – Average number of guests per week
Avg Prof income per week – Average income per week for the date the period selected
Wages inc NIC – Wage total
Wages as % of income – Percentage of wages against total income
Email or Schedule the report
You have the option to email this report to any email address you input, or you can schedule this report to automatedly send to your inbox daily, weekly or monthly.
For any questions regarding the 365 tracker and trend sheet on SalonIQ please call us 01892 280123 or email your questions to help@saloniq.com